

Welcome to the first edition of the blog for Northeast Washington Trends! The blog captures the most recent updates to the indicators on the Northeast Washington Trends website, and will be sent out on a quarterly basis. Northeast Washington Trends would like to thank the Tri-county Economic Development District, Providence Medical, and other contributors for their support of the project.
Recent Updates
In PEOPLE:
The tri counties’ median age remains remarkably stable…and high.
For the interval 2020-2024, the median age in Northeast Washington was estimated to be 48.1 years. The median is the number that divides a population into two equal halves, and as such, gives a good idea of the “middle.” Census uses a moving 5-year median calculation for populations less than 65,000. The most recent median was the same as the immediately prior periods.
Compared to the nation and Washington, the population here is much older. Their median ages most recently were 38.9 and 38.3 years, respectively, or a decade younger.
Click on the radio buttons in the graph to view the results of each county.
Broadband access continues to climb in the three counties.
For the 5-year period 2020-2024, the estimated number of households in the three counties with broadband access was 24,600, or 86% of all households. These results are up considerably from the first part of the past decade (2015-2019), when the estimated count stood at 19,200 and rate at 73%.
That said, the current overall rate in the three counties still lags the U.S. and state averages, at 91% and 94%, respectively. Of course, the population of both the U.S. and state are much more urban than here, and consequently easier to establish broadband connections.
Click on the radio buttons in the graph to view the results of each county.
In ECONOMIC VITALITY:
Median household income (MHI) has modestly increased in the tri counties.
Median household income, or MHI, is often the preferred measure of the “middle” of the distribution of personal income in a jurisdiction, as it is not influenced by very high (or low) values. And also because it uses as its unit of measure a household, where more than one recipient of income (earned or otherwise) may be present.
For the most recent five-year period, median income here was $67,400. That is up from $50,400 in the first half of the past decade. On the surface, this is quite an increase, but the estimates do not take inflation into account, which was elevated during the pandemic. Compared to U.S. MHI, income here most recently was 83%. This represents a slight, relative improvement: in the 2015-2019 interval, MHI here amounted to 80% of the U.S. estimate.
The number of residents living in poverty continues to stabilize.
The number of a population living at or below the federal poverty line (threshold) is set by family size and annual increases in the Consumer Price Index. For example, in 2024 the poverty threshold for a family of two adults and two children was $30,240. For a family of two adults and one child, it is less.
For the interval 2020-2024, the estimated number of tri-county residents living in poverty was 8,720. This marks a slight decline over the prior two five-year periods, although it is a bit higher than the trough reached in the 2016-2020 period. The current estimate count implies a rate of 13%, or about one out of every eight residents in the three counties find themselves in this situation.
Still, the number and rate are better than at the start of the most recent decade and much better than 15 years ago.
In EDUCATION:
An economy runs on an appropriately educated workforce. What is appropriate for an urban metro area, such as the Seattle-Bellevue area, may not be appropriate for a rural economy, such as northeast Washington. It appears that the degree of educational attainment here matches well with the local sectors that are critical such as manufacturing, government and healthcare.
For the 2020-2024 interval, Census estimates that nearly 40% of the adult population in Northeast Washington has some post-secondary education or an associates degree. (The former category is larger than the latter.) This is far above similar shares in the state and nation, as the graph reveals. And, in contrast to other Eastern Washington counties, the share of the adult population with these levels of educational attainment continues to grow.
In EDUCATION cont.:
The share of the adult population with a bachelor’s degree or higher has ticked up.
As of the interval 2020-2024, the estimated share of the adult population in northeast Washington with at least a bachelor’s degree was about 21%. This represents a slight gain: At the start of the 10-year span, the share was about 19%. Both components – those with a bachelor’s as one’s highest degree or those with a post-baccalaureate degree – gained a bit.
Yet current shares here lie far below those of the U.S. (combined 36%) and Washington (combined 40%).
To simplify the graph, click on the element(s) in the legend you’d like to hide.
Click on the radio buttons in the graph to view the results of each county.
In ENVIRONMENT:
Overall water quality of the Columbia River at Northport improved in 2025.
The water quality index (WQI) used here, from the Washington Department of Ecology, puts together several sub measures, such as turbidity, heavy metals, bacteria count, temperature, dissolved oxygen and phosphorous. The best value is 100; any value over 80 indicates “of lowest concern.” Values between 40 and 80 are of “marginal concern.”
After several years of marginal concern for the river health at Northport, Ecology calculated a WQI value of 96 for 2025. This represents the highest reading on record.
Click on the radio buttons in the graph to view the results of each county.
In HEALTH:
The number of northeast Washington residents without health insurance is the fewest to-date.
For the 5-year period 2020-2024, the estimated average annual number of residents without some form of health insurance was about 4,000. This is slightly lower than at the start of the decade (2015-2019) when the estimated count stood at 4,400. This downward trend bucks the experience of many eastern Washington counties.
For the first time, the share of the population in the three counties without health insurance is lower than the state average, already far below the national average.
Click on the radio buttons in the graph to view the results of each county.
In HOUSING:
The number of renters paying 50% or more of their income on shelter costs continues to decline.
For decades, the federal government has established a rule that any household paying more than 30% on their income on either rent or mortgage payments (plus any additional fees) is “housing burdened.” For those residents paying more than 50% of their income on shelter costs, the Department of Housing & Urban Development characterizes them as “severely housing costs burdened.”
For the most recent period, 2020-2024, the number of renters in Northeast Washington falling into this unfortunate category was 783, a bit above the prior 5-year interval’s estimate. It translates into a rate of all renters of 14%. This outcome lies well below the rates in the U.S. and state and much lower than the rate here from years ago.
In PUBLIC SAFETY:
Incidents of domestic violence climbed again in 2024.
The number of domestic violent events known to law enforcement jumped in 2024 in the tri counties. The number hit a low of 387 immediately before the pandemic and has risen since then. In 2024, the number was 481, implying a rate of 7 incidents per 1,000 residents.
Yet the number of offenses is far lower than a decade ago and the resulting rate is considerably below that of the state.
Click on the radio buttons in the graph to view the results of each county.
list updated 3.18.26
New Intern Features
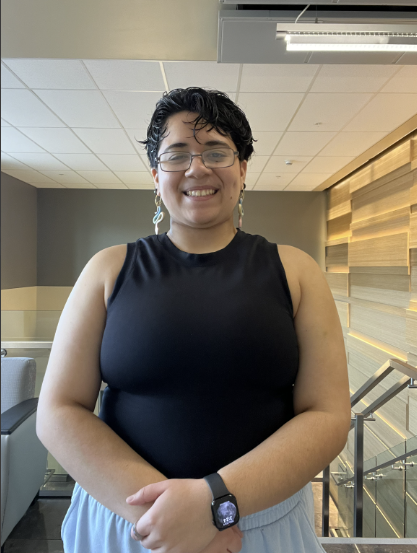
Moon Alvarez
Hometown: Wapato, WA
Major: Accounting and Human Resources
Expected Graduation Date: Spring 2028
Post-graduations plans: Follow the job opportunities, whether here or elsewhere!
After a few months of working on the Trends project, my favorite thing so far:
My favorite thing so far is updating the indicators! I've always been a big numbers person. Updating indicators and seeing the way everything has changed over time is extremely interesting.